


The secret world under Antarctica reveals
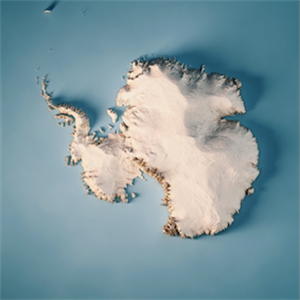
The geological structure under the white continent was only predicted until now. However, with a scientific study published recently, the surface under the Antarctic ice cover was mapped with an unprecedented clarity. The researchers who benefit from the movement physics of satellite data and frosts revealed the presence of thousands of new hills, backs and valleys. This discovery is important not only the geology of the continent, but also to understand how it reacts against climate change. The ‘Buz six map of Antarctica was limited to radar measurements, which were only at certain intervals. Therefore, information about the broad regions of the continent was missing. Thanks to new methods, the movements formed on the surface of the ice layer were analyzed and the structure under which it was modeled in much more detail. Especially when the large areas in Western Antarctica are located under the sea level, the previously unknown number of upgrades and collapsed. This new map gives scientists the opportunity to make Antarctica more accurate predictive on how to live a melting process in the future. Because terrain shapes underlying ice are directly affecting what quickly the frosts will be lost and how much sea level will affect.
Forms the past future under the length][
Antarctic calules are not only frozen water masses, but also natural archives that bear climate tips of thousands of years ago. The remaining mountains under the ice, valleys and collapses, determine the movement speed and direction of the frosts. This also directly affects the change in the global sea level. Thanks to the new map, scientists can see the details of the underwater land. These details are critical to understand what regions in the future will be faster and how much this melt will rise to the sea level. Especially under the sea level of the large part of the West Antarctica, increasing the risk of sliding the frosts in this region. According to scientists, such data is necessary not only for the production of academic information, but also in terms of directing climate policies. Because we predict how long the regions will be affected; not only for the environment, coastal cities, agricultural areas and global migration movements can also be decisive. [
[
How to create a new map?]
To see how detailed the topox under the ice of Antarctica was not possible for many years. Traditional methods were mostly based on radar technology to see the golden of the ice. However, these measurements were often filled with as they can only be done on certain lines and in rare intervals, in combination gaps were filled with assumptions. In this new study, the researchers examined the shape of the ice surface with satellite data and the flow speeds of the frosts. With the physical information about how the ice flows, this surface data was combined and the shape of the land under it was removed. So small folds on the top of the ice have hinted about the structures under the ice, just like the waves on the surface of the water indicate the rocks at the bottom. Thanks to this method, not only known large mountain rows, tens of thousands of small hills, backs and channels were revealed. Even in Maud Altbuzul Basin, the presence of a channel about 400 kilometers long was detected. Such details were included only among default structures before. The main contribution of the research is the high resolution that this map offers. Now scientists have the data that can model future behaviors of the frosts more accurately. This means that scenarios for climate change can be prepared more hit.
Why is important in terms of urinary crisis?]
One of the most critical elements that determine how the ice sheets in Antarctica will melt in the future, what the global sea levels will rise quickly. Therefore, knowing how there is a ground under the frosts, not only geological wonders; direct interest the future of climate science. The slope of the terrain under the calves, height, roughness and details, as close to the water, determine how quickly the ice will move. For example, a frost that sits on a surface of six slopes and slippery, heats faster and reaches the sea faster. This creates a serious threat for the balance of the ice layer. Thanks to the new map, the more clearly understanding of the ophul six ballographs makes the ice flow rate and therefore the melting rate more realistic modeling. This also copes with less uncertainty in future sea level predictions. According to scientists, it is not possible to correctly calculate the contribution of Antarctica without such advanced models. Yet the dynamics of the ice system are not only for polar areas; it is vital for all regions left under coastal strips, islands and sea level. In short, understanding the hidden geography under the Antarctica can provide us with more preparation against environmental crisis waiting for us in the future. If we have a sharper map, our responsibilities are more clearly.
Forms the past future under the length][
Antarctic calules are not only frozen water masses, but also natural archives that bear climate tips of thousands of years ago. The remaining mountains under the ice, valleys and collapses, determine the movement speed and direction of the frosts. This also directly affects the change in the global sea level. Thanks to the new map, scientists can see the details of the underwater land. These details are critical to understand what regions in the future will be faster and how much this melt will rise to the sea level. Especially under the sea level of the large part of the West Antarctica, increasing the risk of sliding the frosts in this region. According to scientists, such data is necessary not only for the production of academic information, but also in terms of directing climate policies. Because we predict how long the regions will be affected; not only for the environment, coastal cities, agricultural areas and global migration movements can also be decisive. [
[
How to create a new map?]
To see how detailed the topox under the ice of Antarctica was not possible for many years. Traditional methods were mostly based on radar technology to see the golden of the ice. However, these measurements were often filled with as they can only be done on certain lines and in rare intervals, in combination gaps were filled with assumptions. In this new study, the researchers examined the shape of the ice surface with satellite data and the flow speeds of the frosts. With the physical information about how the ice flows, this surface data was combined and the shape of the land under it was removed. So small folds on the top of the ice have hinted about the structures under the ice, just like the waves on the surface of the water indicate the rocks at the bottom. Thanks to this method, not only known large mountain rows, tens of thousands of small hills, backs and channels were revealed. Even in Maud Altbuzul Basin, the presence of a channel about 400 kilometers long was detected. Such details were included only among default structures before. The main contribution of the research is the high resolution that this map offers. Now scientists have the data that can model future behaviors of the frosts more accurately. This means that scenarios for climate change can be prepared more hit.
Why is important in terms of urinary crisis?]
One of the most critical elements that determine how the ice sheets in Antarctica will melt in the future, what the global sea levels will rise quickly. Therefore, knowing how there is a ground under the frosts, not only geological wonders; direct interest the future of climate science. The slope of the terrain under the calves, height, roughness and details, as close to the water, determine how quickly the ice will move. For example, a frost that sits on a surface of six slopes and slippery, heats faster and reaches the sea faster. This creates a serious threat for the balance of the ice layer. Thanks to the new map, the more clearly understanding of the ophul six ballographs makes the ice flow rate and therefore the melting rate more realistic modeling. This also copes with less uncertainty in future sea level predictions. According to scientists, it is not possible to correctly calculate the contribution of Antarctica without such advanced models. Yet the dynamics of the ice system are not only for polar areas; it is vital for all regions left under coastal strips, islands and sea level. In short, understanding the hidden geography under the Antarctica can provide us with more preparation against environmental crisis waiting for us in the future. If we have a sharper map, our responsibilities are more clearly.
Source: News